# Impacts of Cooling
# Visualizing Water Consumption: US Data Centers
[](https://hydraulogistics.at/uploads/images/gallery/2025-09/scaled-1680-/ngDmap-try-fri.jpg)
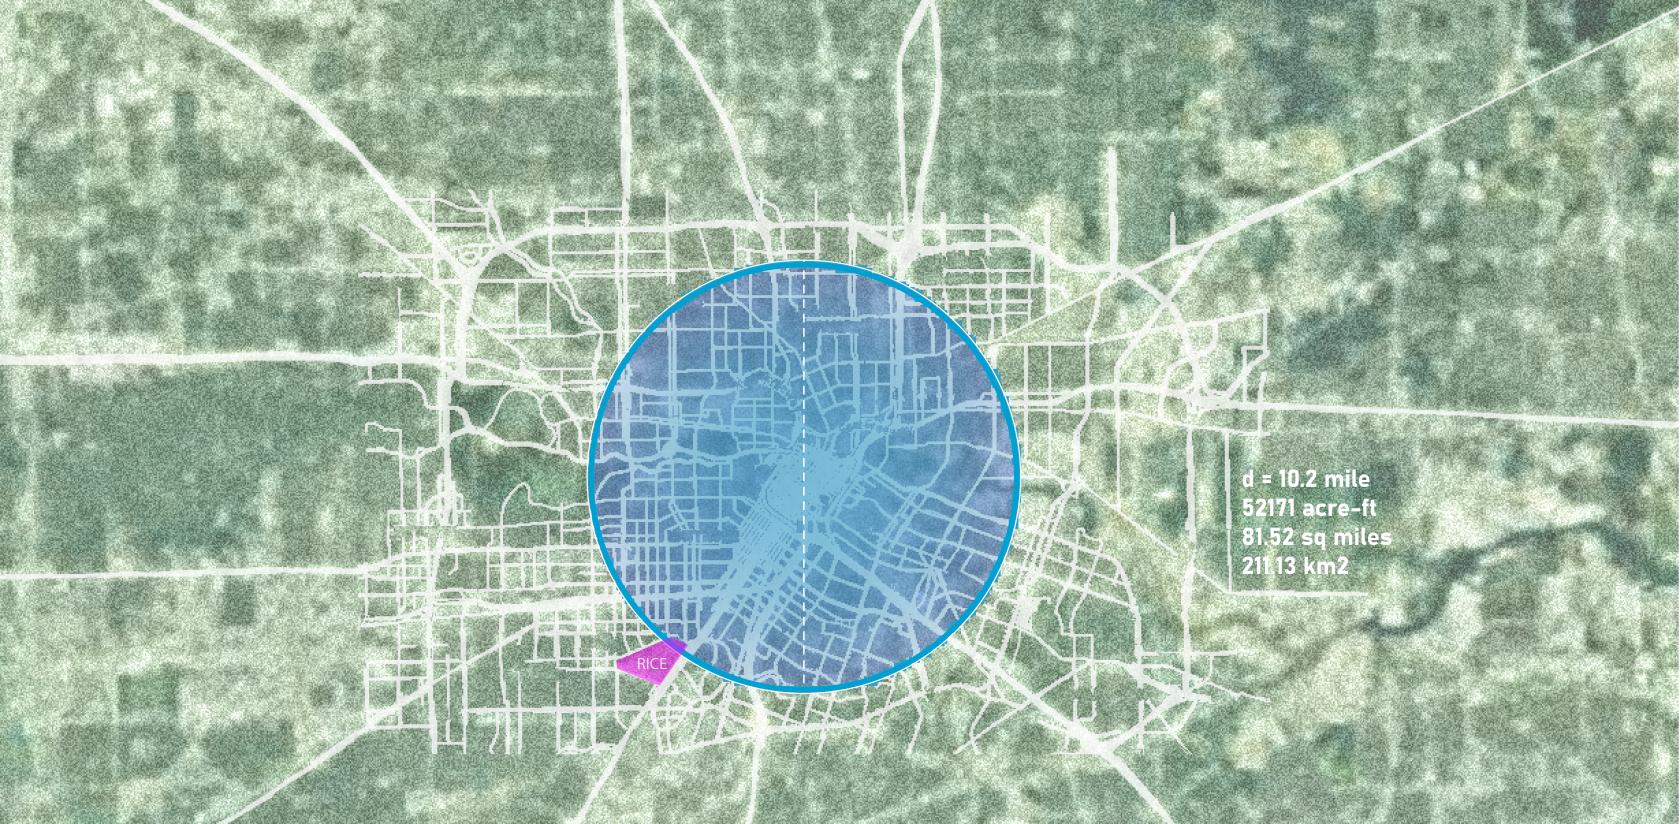
In 2023 alone, US data centers consumed an estimated **17 billion gallons** of water. That's 52,171 [acre-feet](https://hydraulogistics.at/link/16#bkmrk-acre-foot) of water, enough to cover a **10.2-mile-wide circle** in a foot of water!
[](https://hydraulogistics.at/uploads/images/gallery/2025-09/scaled-1680-/5bayou-map.png)
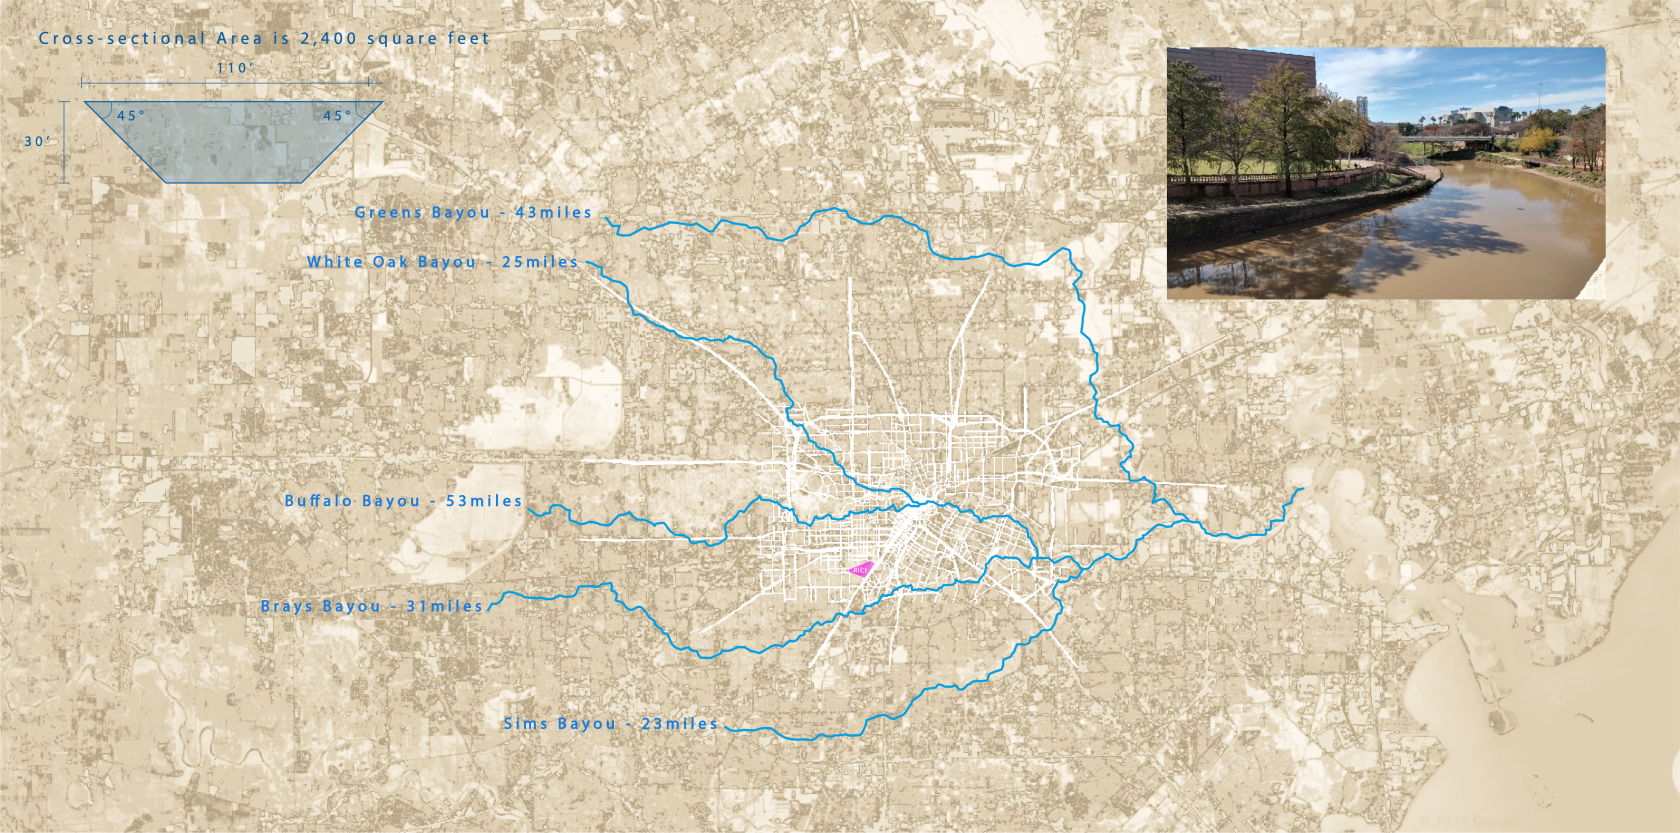
Estimating the average cross-sectional area of a bayou channel at 2,400 square feet, **the 17 billion gallons of water consumed by US data centers in 2023 could fill 179 miles of bayou channels**, which is longer than the combined length of all of Houston's 5 major bayous (175 miles).
# Visualizing Water Consumption: Hyperscale Data Centers
[![anderson submerged 2 [Converted].png](https://hydraulogistics.at/uploads/images/gallery/2025-09/scaled-1680-/anderson-submerged-2-converted.png)](https://hydraulogistics.at/uploads/images/gallery/2025-09/scaled-1680-/anderson-submerged-2-converted.png)
[![rice submerged [Converted].png](https://hydraulogistics.at/uploads/images/gallery/2025-09/scaled-1680-/rice-submerged-converted.png)](https://hydraulogistics.at/uploads/images/gallery/2025-09/scaled-1680-/rice-submerged-converted.png)
Just **one hyperscale data center** uses about **200 million gallons of water per year**; enough water to fill the entire area enclosed by Rice University's inner loop to a depth of **13.85 feet**!
# Visualizing Water Consumption: Non-potable vs Potable
[](https://hydraulogistics.at/uploads/images/gallery/2025-09/scaled-1680-/circle-map.png)
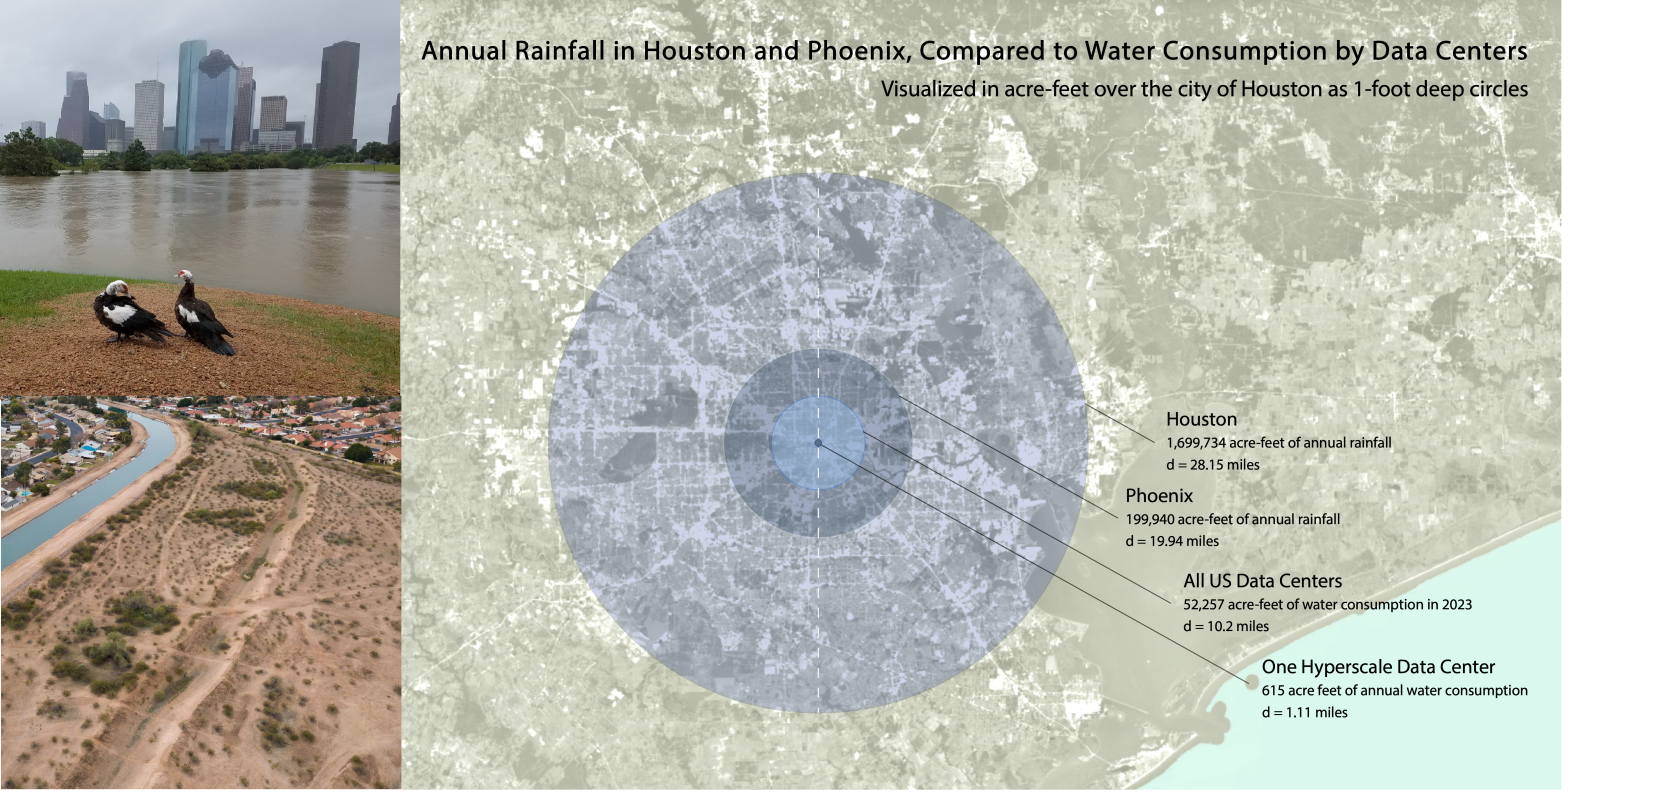
This figure highlights the contrast between city rainfall and the scale of water consumption by data centers. Houston, with nearly 1.7 million [acre-feet](https://hydraulogistics.at/link/16#bkmrk-acre-foot) of annual rainfall, receives more than eight times Phoenix’s 200,000 acre-feet. This is a reflection of their climates, the former being [water-abundant](https://hydraulogistics.at/books/chilled-infrastructures/page/data-centers-in-coastal-areas "Data Centers in Coastal Areas") and the latter [drought-prone](https://hydraulogistics.at/books/chilled-infrastructures/page/data-centers-in-hot-dry-climates "Data Centers in Hot, Dry Climates"). When placed against these baselines, the water use of data centers appears smaller but remains very significant. In 2023, all U.S. data centers together consumed about 52,257 acre-feet of water—roughly a quarter of Phoenix’s annual rainfall. A single [hyperscale data center](https://hydraulogistics.at/link/16#bkmrk-hyperscale-data-cent) alone uses around 615 acre-feet annually, visualized here as just over a 1-mile-wide circle.
Although total rainfall, even in drought-prone Phoenix, far exceeds the water consumption of data centers, the central issue is the type of water they use. Most data centers rely on potable, drinking-grade water rather than reclaimed or non-potable sources. For instance, Google reported that in 2023 only about 22% of its water withdrawals for data centers came from reclaimed or non-potable sources, meaning that the remaining 78% was potable water. This reliance means that data centers compete directly with local communities for limited supplies of drinking water.
The reason reclaimed water is not more widely used lies in both technical and regulatory challenges. Non-potable water can accelerate corrosion, scaling, and microbiological growth in cooling systems, which in turn shortens equipment life and increases maintenance. To manage this, engineers must regularly assess water quality, including pH, conductivity, total dissolved solids, chlorides, silicon, hardness, alkalinity, and microbial counts. They often need to work with local utilities to request additional treatment or to identify alternative sources that can reduce risks to equipment performance.
There are also practical barriers, such as using reclaimed water requires more frequent cleaning and specialized equipment to handle impurities. Permitting is often complex, and compatibility with treatment plants is not always guaranteed. Many areas also lack infrastructure such as purple pipe systems, which are designed to deliver non-potable water for industrial use. On top of that, advanced treatments such as ultrafiltration, ozonation, or reverse osmosis can make reclaimed water safer for cooling, but increase costs and add operational complexity.
Despite these challenges, some companies have made progress. Microsoft’s facility in Quincy, Washington, uses untreated irrigation canal water for cooling, relying on only about 5% potable water. To deal with mineral buildup and wastewater issues, the company and the city developed the Quincy Water Reuse Utility, a closed-loop treatment system that recycles cooling water and saves an estimated 138 million gallons of potable groundwater annually. Similarly, Amazon has also expanded its use of recycled wastewater, treating and reusing it by developing a plant-based treatment method using sphagnum moss to reduce chemical use while improving water quality. Moreover, Digital Realty in Singapore has deployed an electrolytic descaling system that prevents impurities from accumulating and allows water to be reused more times before discharge.
# Comparing Impacts by Cooling Type
[](https://hydraulogistics.at/uploads/images/gallery/2025-09/scaled-1680-/Wvzwue-pue-iwu.png)
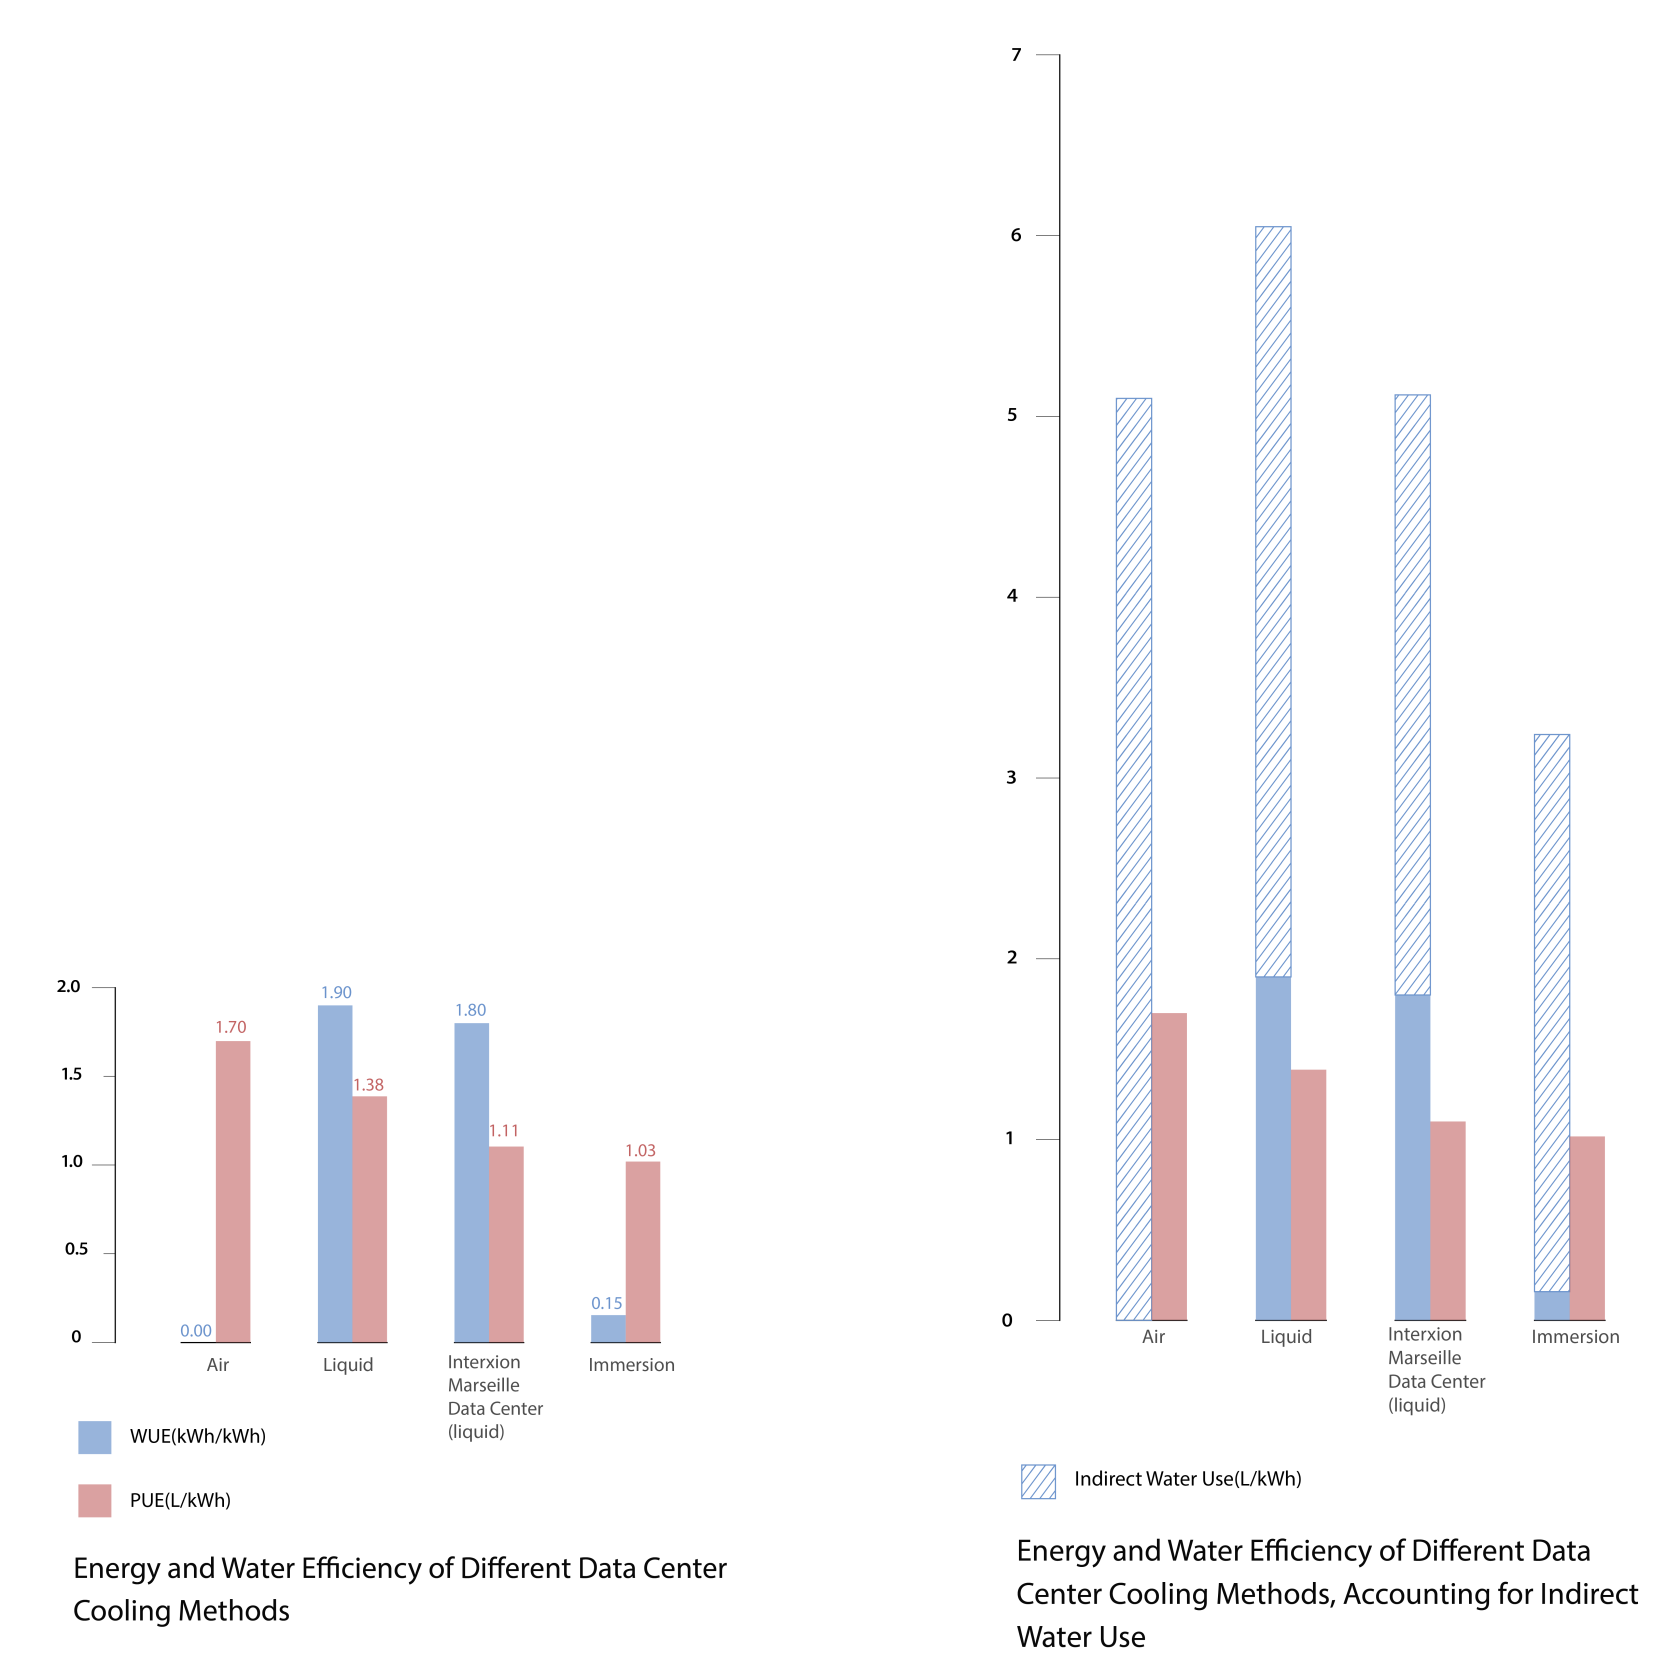
[Power Usage Effectiveness](https://hydraulogistics.at/link/16#bkmrk-pue) (PUE) = [Facility power](https://hydraulogistics.at/link/16#bkmrk-facility-power) (kWh)/[IT equipment power](https://hydraulogistics.at/link/16#bkmrk-it-equipment-power) (kWh)
[Water Usage Effectiveness](https://hydraulogistics.at/link/16#bkmrk-wue) (WUE) = Water usage (L)/[IT equipment power](https://hydraulogistics.at/link/16#bkmrk-it-equipment-power) (kWh)
Power Usage Effectiveness (PUE) and Water Usage Effectiveness (WUE) are ratios used to describe how efficiently data centers use energy and water. [PUE](https://hydraulogistics.at/link/16#bkmrk-pue) is calculated by dividing a data center’s total facility power by its required IT equipment power, which means that a PUE of 1.0 represents maximum efficiency, with 100% of the power used by the data center used for IT equipment and 0% for cooling and support systems. A higher PUE represents a higher proportion of the data center’s total energy consumption used for cooling and support systems.
[WUE](https://hydraulogistics.at/link/16#bkmrk-wue) is calculated by dividing a data center’s total water consumption by its required IT equipment power. A PUE of 1.0 represents a data center that uses one liter of water for every [kWh](https://hydraulogistics.at/link/16#bkmrk-kwh) of power its IT equipment uses, so a higher PUE signifies higher water consumption relative to computational power.
However, WUE does not account for water consumed throughout the process of producing the energy supplied to the data center. Fossil fuel energy production uses about 3 liters of water for each kWh of electricity produced, so by multiplying total facility power by 3, we can visualize the [indirect water use](https://hydraulogistics.at/link/16#bkmrk-indirect-water-use) relative to computational power for each data center cooling type.
# Trends in Data Center Efficiency
[![trajectory map [Converted].png](https://hydraulogistics.at/uploads/images/gallery/2025-09/scaled-1680-/trajectory-map-converted.png)](https://hydraulogistics.at/uploads/images/gallery/2025-09/scaled-1680-/trajectory-map-converted.png)
Recent years have witnessed a shift in the U.S. data center size, with the top panel showing how the percentage of servers housed in [hyperscale ](https://hydraulogistics.at/link/16#bkmrk-hyperscale-data-cent)and large [colocation](https://hydraulogistics.at/link/16#bkmrk-colocation-center) centers has grown steadily since 2014, while small/medium colocation facilities have remained relatively stable.
The middle panel illustrates the corresponding annual average [PUE](https://hydraulogistics.at/link/16#bkmrk-pue). As [hyperscale](https://hydraulogistics.at/link/16#bkmrk-hyperscale-data-cent) and colocation sites expanded, [PUE ](https://hydraulogistics.at/link/16#bkmrk-pue)declined from 1.6 in 2014 to just above 1.4 by 2023. This indicates that facilities are using less overhead energy per unit of IT load, which is more efficient. The shaded trajectory area suggests future projections, with [hyperscale ](https://hydraulogistics.at/link/16#bkmrk-hyperscale-data-cent)operators pushing [PUE](https://hydraulogistics.at/link/16#bkmrk-pue) closer to 1.2 or lower in coming years.
The bottom panel highlights the annual average [WUE](https://hydraulogistics.at/link/16#bkmrk-wue). While energy efficiency has improved, [WUE](https://hydraulogistics.at/link/16#bkmrk-wue) has gradually risen from 0.36 L/kWh in 2014 to 0.38 L/kWh in 2023. This reflects the trade-off: [hyperscale ](https://hydraulogistics.at/link/16#bkmrk-hyperscale-data-cent)and colocation sites often rely on evaporative cooling methods (cooling towers, adiabatic systems) that use water more intensively. In effect, operators are substituting water resources to reduce electricity demand, achieving lower [PUE](https://hydraulogistics.at/link/16#bkmrk-pue) but at the expense of higher water consumption.
As the share of [hyperscale ](https://hydraulogistics.at/link/16#bkmrk-hyperscale-data-cent)and large colocation data centers increases, [PUE](https://hydraulogistics.at/link/16#bkmrk-pue) improves while [WUE](https://hydraulogistics.at/link/16#bkmrk-wue) worsens. This indicates a clear inverse correlation: efficiency gains in electricity use are being achieved at the cost of higher water consumption. Looking ahead, the dotted trajectory line indicates that this trend is expected to continue. [Hyperscale ](https://hydraulogistics.at/link/16#bkmrk-hyperscale-data-cent)dominance will likely push [PUE](https://hydraulogistics.at/link/16#bkmrk-pue) further down, but [WUE](https://hydraulogistics.at/link/16#bkmrk-wue) will increase.
# Data Centers in Hot, Dry Climates
[](https://hydraulogistics.at/uploads/images/gallery/2025-09/scaled-1680-/drought-together.png)
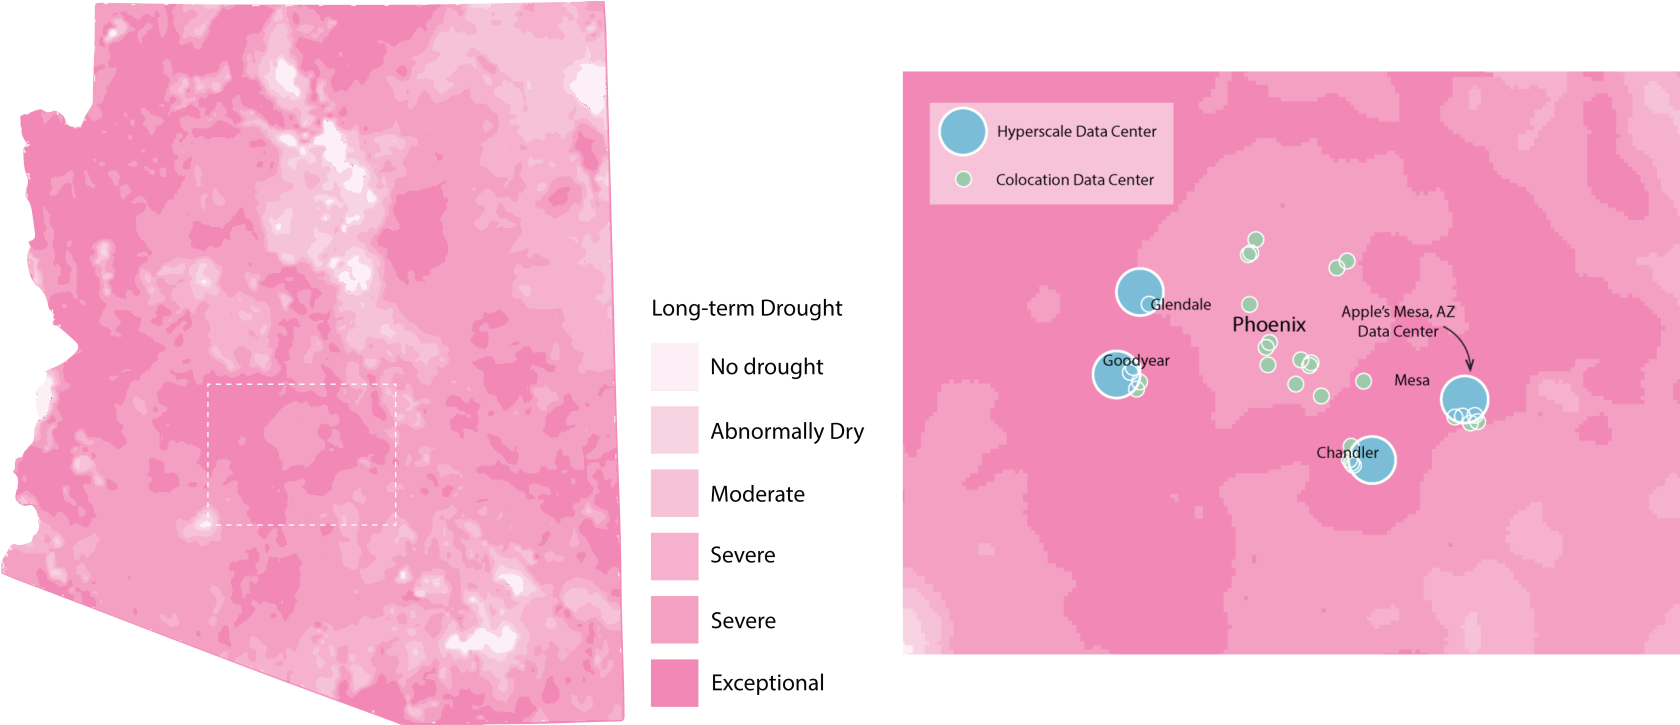
In hot, dry climates, the high water demand from data centers can put immense pressure on the local water supply, exacerbating the effects of drought conditions. Because [data centers mostly use potable water](https://hydraulogistics.at/books/chilled-infrastructures/page/visualizing-water-consumption-non-potable-vs-potable "Visualizing Water Consumption: Non-potable vs Potable"), this puts them in direct competition with local communities for drinking water. Nonetheless, major tech companies continue to plan, build, and operate [hyperscale](https://hydraulogistics.at/link/16#bkmrk-hyperscale-data-cent) data centers in hot, dry areas, with seemingly little regard for their impact on residents and the local environment. Locations for data centers generally depend on factors like proximity to customers and infrastructure, land and electricity prices, and tax incentives, and many data center companies are attracted to water-scarce regions in the western United States like Arizona due to the availability of solar and wind energy, despite the lack of water. In fact, an estimated one-fifth of data centers, mostly in the West, source their water from moderately to highly stressed watersheds.
For example, there are several hyperscale data centers in the Phoenix metropolitan area, where water has to be supplied from over 200 miles away due to long-term drought. Despite this, Apple's data center in [Mesa, Arizona](https://hydraulogistics.at/books/chilled-infrastructures/page/mesa-arizona "Mesa, Arizona") uses [evaporative cooling](https://hydraulogistics.at/link/16#bkmrk-evaporative-cooling) (which is associated with high water consumption) because of the high price of energy relative to water.
# Data Centers in Coastal Areas
[](https://hydraulogistics.at/uploads/images/gallery/2025-09/scaled-1680-/finland.webp)
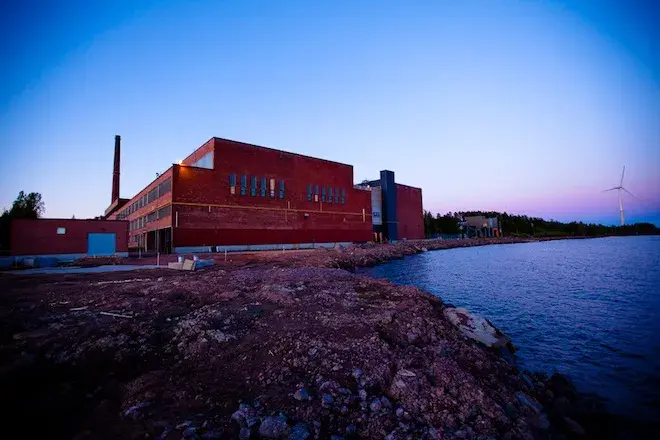
**Image: A Google data center in Finland that utilizes seawater cooling**
Coastal areas may appear to have an abundance of water, but this does not mean they are unaffected by the massive water demands of data centers. Some coastal data centers use seawater for cooling, which reduces consumption of freshwater and competition with local communities for potable water. However, seawater cooling still imposes negative environmental consequences, like the degradation of coastal ecosystems due to development in close proximity to the coast and disruption of marine life due to thermal pollution from discharged warm water.
Further, since seawater cooling systems are generally much more expensive and more difficult to implement, [most data centers require potable water for cooling](https://hydraulogistics.at/books/chilled-infrastructures/page/visualizing-water-consumption-non-potable-vs-potable "Visualizing Water Consumption: Non-potable vs Potable"), meaning they instead compete with residents for freshwater from sources like surface water and underground aquifers, contributing to water scarcity. In the long term, over-pumping from groundwater sources can cause issues like [subsidence](https://hydraulogistics.at/link/16#bkmrk-subsidence) and seawater intrusion in some coastal areas, including the Gulf Coast.
Even in areas with extensive freshwater resources, water is never as abundant as it seems. For example, in the [Great Lakes region](https://hydraulogistics.at/books/chilled-infrastructures/page/chicago-illinois "Chicago, Illinois"), the rapidly growing quantity of data centers that source their water from the lakes poses a threat to the more than 40 million people whose drinking water comes from the same source. The Great Lakes hold about 20% of the planet's surface freshwater, and seem almost inextinguishable, but with a replenishing rate of only about 1% of their total volume per year, the lakes are at risk of depletion over time by the billions of gallons of water annually demanded by data centers.